Tutorial
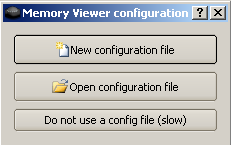
When the Memory Viewer plugin is loaded, several possibilities are offered:

The first two possibilities are clear once you know what is a configuration file (see below), and the third one just runs the plugin without any configuration (and therefore watch the entire ALMemory content).
What is a configuration file ?
When you execute a Memory Viewer, you must know that the ALMemory content is big, even huge, so you do not want to watch all the variables. When you create a configuration file, you are going to select, among the ALMemory, what are the values you are interested in. You can also give them an alias if you want to have clearer or shorter names (just double click on the name in the table, and you can rename it). The configuration file will just save which variables and eventually their aliases. As it is sometimes hard to find the variables you want in the ALMemory, you only have to do it once. As the configuration files are stored in xml files, you can even modify them easily.
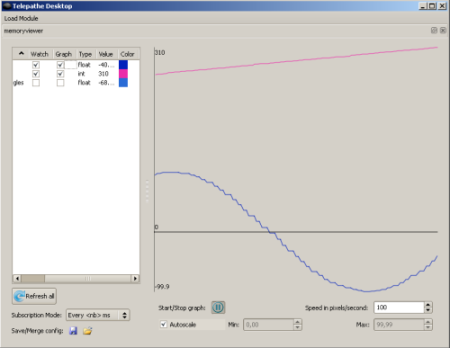
Once you have finished and saved your configuration file, the plugin will load its main window:

From there, you can choose what variables you want to watch and/or graph. Graphing a variable will automatically watch it in order to have a graph up-to-date. Data are refreshed using the subscription mode chosen. By default, there is no subscription, so the data you graph or watch will have a constant value. Switching the subscription mode will automatically change the way data is refreshed. You can also manually refresh all the variables if you want (button "").
It is also possible to save or import a configuration file. Saving it will keep everything you have modified in the left table (watch ? graph ? color in graph...). If you choose to import an existing file, it will merge them in the left table.
The right panel is the graph. You can choose to start/stop it. The x axe represents the time, and the values go from right (most recent) to left (oldest). The speed of the graph can be changed manually in pixel/sec.
| Note: | The graph will progress in time no matter what the subscription is. If the time policy is too slow, you will see levels on your curves. |
|---|
The autoscale option is quite clear: it will ensure that all the curves are always visible. But sometimes, you may want to zoom on a particular zone of the graph, and therefore disable the autoscale to use the y min and max you entered.

